
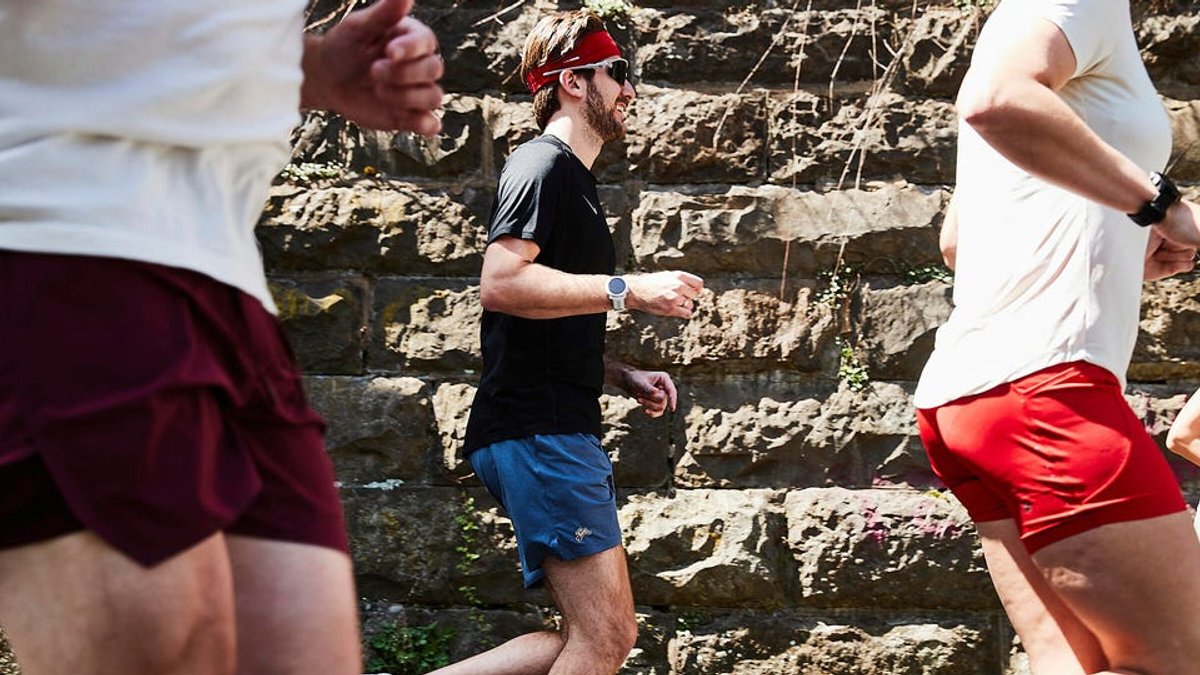
Understanding the average running pace per age group can help runners gauge their performance and set realistic goals.
Age‑based pace data from major platforms
Garmin’s global dataset, covering February 2025 through January 2026, shows an overall average mile time of 9:21 for men and 10:11 for women. When broken down by age, the numbers shift slightly:
- 20‑29 years: 9:16
- 30‑39 years: 9:29
- 40‑49 years: 9:39
- 50‑59 years: 9:56
- 60‑69 years: 10:22
- 70 + years: 10:57
Coros, analyzing activity logs from July 2025 to June 2026, reports a faster overall average for the youngest cohort, with 8:59 for ages 20‑29. Their age‑group breakdown continues as follows:
- 30‑39 years: 9:43
- 40‑49 years: 10:06
- 50‑59 years: 10:44
- 60‑69 years: 11:36
- 70 + years: 13:01
Seasonal trends appear in Coros’ data. In summer, mile times rise modestly for all groups except those over 70, whose pace improves slightly. Winter figures show a small dip in times for most runners, suggesting cooler weather may aid faster running for many age brackets.
Related: Grieving Mother Refuses to Be ‘Strong’
Generational differences and influencing factors
Strava’s generational breakdown paints a broader picture: Gen Z averages 9:55 per mile, Millennials 9:49, Gen X 10:10, and Boomers 11:11. The variation aligns with the age‑group results from Garmin and Coros, though the generational lens adds context about cultural and training trends.
Multiple variables shape these averages. Gender, age, weather conditions, nutrition, injury history, body composition, and terrain all play roles. Even mental factors such as mindset can influence speed, though they are within a runner’s control. Height and age, by contrast, are immutable.
Data from Runner’s World indicates many athletes maintain or improve performance well into their 60s and 70s. Peaks often occur in the 30s, but consistent training can offset age‑related declines.
When setting race goals, runners can use pace charts to translate desired finish times into required per‑mile speeds. For a 10‑mile target of 1 hour 45 minutes, the chart suggests maintaining roughly a 10:29 mile pace. Tools that calculate needed average pace based on a target finish time can help plan training intensity.
Related: Kids Fear Food, Diagnosed with ARFID
Improving average speed typically involves building an endurance base through easy runs, incorporating zone‑2 mileage, and adding VO2‑max workouts. Threshold sessions, varied run types, form drills, and strength training all contribute to faster, more efficient running.
Historically, the rise of wearable technology has expanded the pool of recorded runs, making recent averages more representative than earlier, smaller datasets.
Future averages may shift as more runners adopt these devices, potentially narrowing gaps between age groups as training knowledge spreads.
Overall, the combination of Garmin, Coros, and Strava data offers a useful benchmark for runners seeking to understand where they stand within their age cohort. By comparing personal times to these averages, athletes can identify areas for improvement and set informed, attainable goals.


